Deploying voice AI is just the beginning. Understanding whether it works—and how to improve it—requires the right analytics. Unlike web analytics where clicks and pageviews tell a clear story, voice AI metrics must capture the nuances of conversation quality, user intent, and task completion.
At Demogod, we track dozens of metrics to optimize our voice AI agents. Here is what matters, how to measure it, and what the numbers should look like.
Core Voice AI Metrics
Conversation Completion Rate
The percentage of voice sessions that reach a defined endpoint—whether that is answering a question, completing a task, or achieving a conversion.
How to measure: Define success states for your voice AI (demo completed, question answered, handoff to human). Track sessions reaching these states divided by total sessions.
Benchmarks:
- Simple FAQ bots: 70-85% completion
- Product demos: 50-65% completion
- Complex transactions: 40-55% completion
Red flags: Below 40% suggests fundamental UX or recognition issues.
Task Success Rate
Did users accomplish what they came to do? This differs from completion rate—a user might complete a conversation but fail to get their answer.
How to measure: Post-conversation surveys, implicit signals (did they try again immediately?), or manual transcript review.
Benchmarks: Target 80%+ for well-designed voice experiences.
Average Conversation Duration
Time from session start to end. Context matters: longer is not always better.
How to interpret:
- Support queries: Shorter is better (quick resolution)
- Product demos: Moderate length indicates engagement
- Sales conversations: Longer often correlates with conversion
Typical ranges:
- FAQ interactions: 30-90 seconds
- Product demos: 2-5 minutes
- Complex support: 3-8 minutes
Turns Per Conversation
The number of back-and-forth exchanges. High turn counts can indicate engagement or confusion.
Analysis approach: Segment by outcome. High turns with successful completion = engaged user. High turns with abandonment = struggling user.
Speech Recognition Metrics
Word Error Rate (WER)
The percentage of words incorrectly transcribed. Lower is better.
How to measure: Sample transcripts, manually correct them, calculate: (Substitutions + Insertions + Deletions) / Total Words
Benchmarks:
- Clean audio, native speakers: 5-10% WER
- Accented speech: 10-15% WER
- Noisy environments: 15-25% WER
- Phone audio: 12-20% WER
Recognition Confidence
Most ASR systems return confidence scores. Track the distribution.
Key thresholds:
- Above 0.9: High confidence, act on result
- 0.7-0.9: Moderate confidence, may need confirmation
- Below 0.7: Low confidence, request clarification
Alert on: Rising percentage of low-confidence results suggests audio quality issues or vocabulary gaps.
No-Speech Timeouts
How often does the system wait for speech and receive none?
Causes: User confusion, microphone issues, users speaking too softly, ambient noise triggering false starts.
Target: Below 5% of turns should timeout.
Intent and Understanding Metrics
Intent Classification Accuracy
If your voice AI uses intent classification, measure how often it identifies the correct intent.
How to measure: Sample conversations, manually label intents, compare to system classifications.
Benchmark: 85%+ accuracy for production systems.
Fallback Rate
How often does the voice AI fail to understand and fall back to a generic response or escalation?
Formula: Fallback responses / Total responses
Target: Below 15% for mature systems. New deployments may see 25-30% initially.
Out-of-Scope Query Rate
Users asking questions your voice AI cannot answer. Not necessarily a failure—it indicates expansion opportunities.
Analysis: Cluster out-of-scope queries to identify patterns. High volume on specific topics suggests feature gaps.
User Experience Metrics
Response Latency
Time from user finishing speech to voice AI beginning response. Critical for natural conversation feel.
Breakdown:
- ASR processing: 200-400ms
- LLM inference: 300-800ms to first token
- TTS generation: 100-300ms to first audio
- Total target: Under 1.5 seconds
User perception:
- Under 1 second: Feels instant
- 1-2 seconds: Natural conversation pace
- 2-3 seconds: Noticeable delay
- Over 3 seconds: Frustrating, users may repeat or abandon
Interruption Rate
How often users interrupt the voice AI mid-response. Some interruption is normal; excessive interruption indicates problems.
Causes of high interruption:
- Responses too long
- Wrong information being provided
- User impatience (latency issues)
- Natural conversation dynamics
Target: 10-20% interruption rate is healthy. Above 30% warrants investigation.
Repeat Rate
How often users repeat themselves, indicating the system did not understand or respond appropriately.
Target: Below 10% of turns should be near-repeats of previous user input.
Business Outcome Metrics
Conversion Rate
For voice AI driving business outcomes, track conversions: demo requests, signups, purchases, qualified leads.
Comparison baseline: Measure against non-voice conversion paths. Voice AI should match or exceed.
Deflection Rate
For support applications, how many queries does voice AI resolve without human escalation?
Formula: (Voice-resolved queries) / (Total queries)
Benchmarks:
- Simple FAQ deflection: 60-80%
- Account inquiries: 40-60%
- Technical support: 30-50%
Cost Per Conversation
Total voice AI costs divided by conversations handled.
Components:
- ASR costs: $0.01-0.02 per minute
- LLM costs: $0.001-0.01 per conversation (varies widely)
- TTS costs: $0.01-0.02 per minute of output
- Infrastructure: Variable
Comparison: Human agent calls cost $5-15 per interaction. Voice AI should be 10-50x cheaper.
Customer Satisfaction (CSAT)
Direct user feedback on the voice experience.
Collection methods:
- Post-conversation voice prompt: "Was this helpful?"
- Follow-up email surveys
- In-app ratings
Benchmark: Target 4.0+ out of 5.0 for voice experiences.
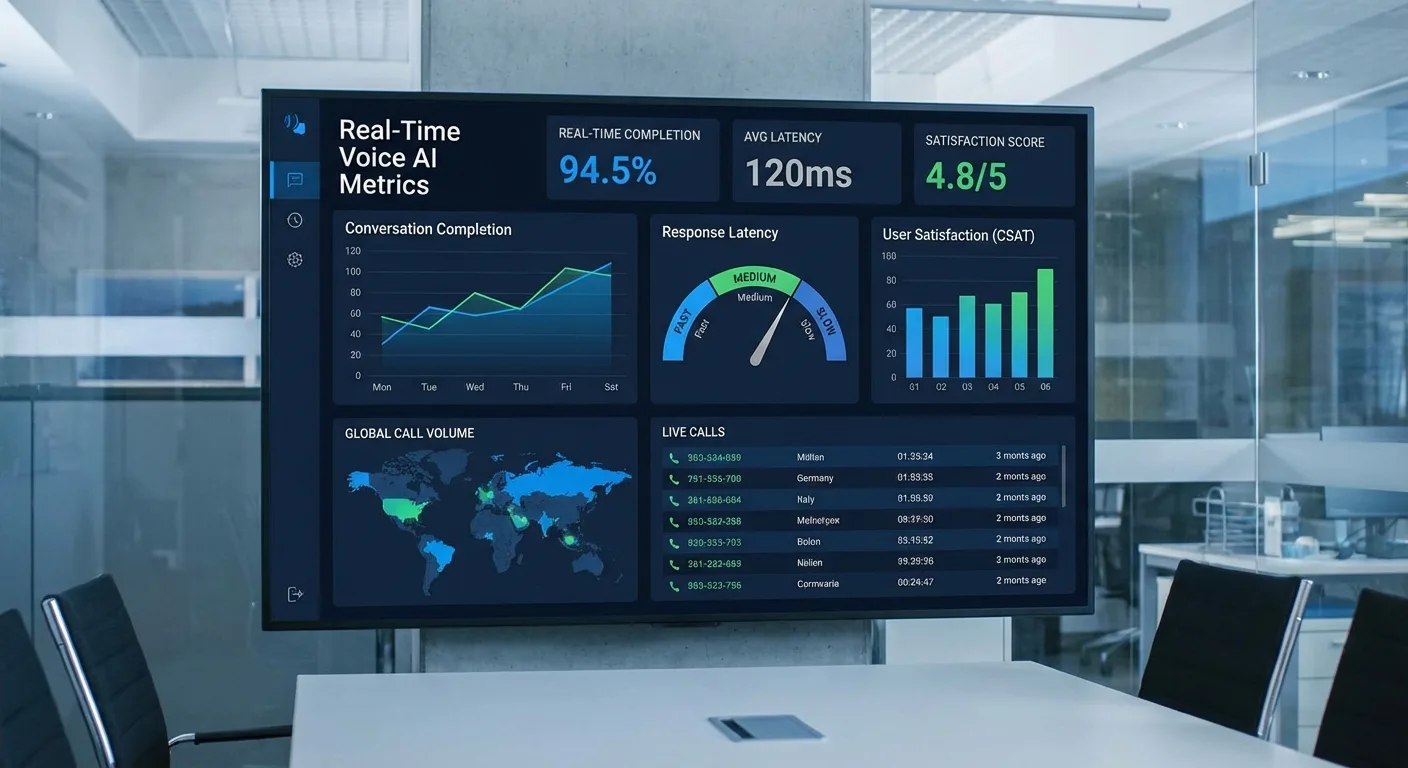
Building Your Analytics Dashboard
Real-Time Metrics
Monitor continuously:
- Active sessions
- Response latency (P50, P95, P99)
- Error rates
- ASR confidence distribution
Daily Review
Check daily:
- Conversation completion rate
- Fallback rate
- Top unhandled intents
- Conversion metrics
Weekly Analysis
Deep dive weekly:
- Transcript sampling and review
- WER spot checks
- User journey analysis
- A/B test results
Monthly Strategy
Strategic review monthly:
- ROI calculation
- Feature gap analysis from out-of-scope queries
- Competitive benchmarking
- Roadmap prioritization based on data
Common Analytics Pitfalls
Vanity Metrics
Total conversations and session counts feel good but do not indicate quality. Focus on completion and success rates.
Averaging Everything
Averages hide problems. A 2-second average latency might mask that 10% of users experience 5+ second delays. Use percentiles.
Ignoring Dropoffs
Users who abandon mid-conversation are your biggest opportunity. Analyze where and why they leave.
Not Segmenting
Aggregate metrics obscure insights. Segment by: user type, time of day, device, entry point, conversation topic.
Continuous Improvement Loop
Analytics should drive action:
- Identify: Find problem areas in metrics
- Investigate: Review transcripts to understand root causes
- Hypothesize: Propose improvements
- Test: A/B test changes
- Measure: Track impact on key metrics
- Iterate: Repeat
Start Measuring Today
You cannot improve what you do not measure. Voice AI analytics reveal the gap between what you think users experience and what actually happens.
Try Demogod to experience voice AI that is continuously optimized through comprehensive analytics. Every conversation teaches us something—and those learnings make the next conversation better.
The best voice AI systems are not built once and forgotten. They are measured, analyzed, and refined continuously. Start with the metrics that matter most to your business, build your measurement infrastructure, and let data guide your voice AI evolution.